


 [Image: courtesy Dan McCarey]
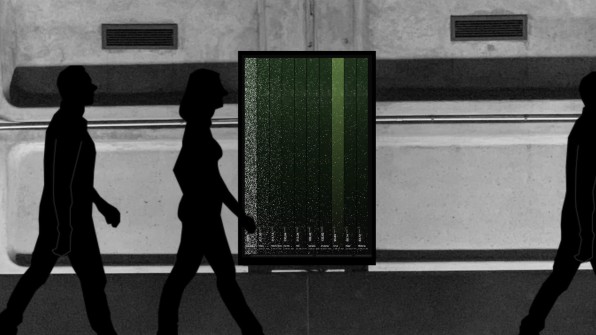
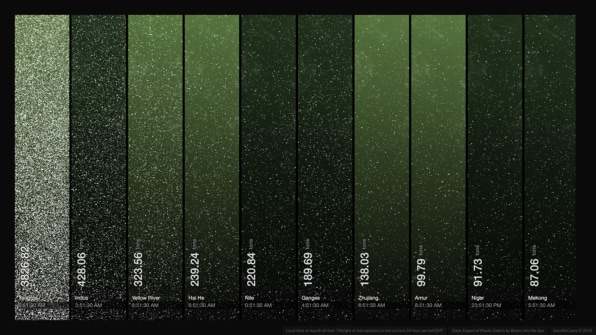
Microplastics, tiny pieces of plastic less than 5 millimeters across, now show up in places as remote as Arctic sea ice and the deep sea, more than 1,000 feet below the surface of the ocean. Much of that plastic is reaching the ocean by flowing through rivers and the largest rivers in densely populated areas are most to blame. A visualization from data artist Dan McCarey shows the estimated flow through 10 key rivers, with the largest amount of plastic in the Yangtze River in China.
advertisementI wanted to do something on microplastics because I thought it was interesting that the volume of microplastics going into the ocean is so huge, says McCarey, who created the data visualization as an entry in an innovation challenge from National Geographic. The data comes from a 2017 study that estimated that 10 rivers the Yangtze, Yellow, Hai, Pearl, Amur, Mekong, Indus, and Ganges Delta, along with the Niger and Nile rivers in Africa are responsible for the vast majority of plastic that flows from rivers to the ocean. I tried to visualize what that flow would look like.
 [Image: courtesy Dan McCarey]The researchers looked at both macro plastics, such as plastic bottles, and the kinds of microplastics that McCarey depicted here. Microplastics could be fragments of larger items, including pieces of packaging or fibers from polyester clothing, or tiny plastic microbeads that are manufactured for use in products like shower gel or laundry detergent. In the case of detergent, it s really scary because [the microbeads] aren t even visible at the point of use, McCarey says.
 [Image: courtesy Dan McCarey]The study s estimates may not fully reflect what s happening within each river; one Chinese study of the Yangtze in 2019 suggested that some plastic gets stuck in the river bed rather than flowing to the sea (it s not good for the river ecosystem either, of course). But it s clear that the amounts of microplastic in these rivers are large. Another study that looked only at microbeads estimated that around 209 trillion plastic microbeads enter the water in China each year. The country will ban microbead production by the end of this year, with a full ban on sales by the end of 2022.
 [Image: courtesy Dan McCarey]
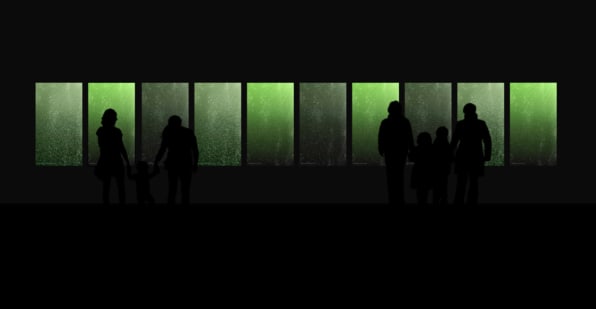
McCarey hopes to work with a museum to install a larger version of the visualization that visitors can explore. If someone looks at a river now, while they might notice larger plastic trash, the smallest microplastics aren t visible. Making the data visible is designed to lead to more support for other solutions from bans on single-use plastic to devices that can help catch larger plastic in rivers before it breaks down.
advertisementadvertisementadvertisementAbout the authorAdele Peters is a staff writer at Fast Company who focuses on solutions to some of the world's largest problems, from climate change to homelessness. Previously, she worked with GOOD, BioLite, and the Sustainable Products and Solutions program at UC Berkeley, and contributed to the second edition of the bestselling book "Worldchanging: A User's Guide for the 21st Century."
Ideas Newsletter
Sign UpReceive special Fast Company offers.See All NewslettersVideoImpact